A Tale of Two Charts (Quant Facts Now 63.5%)
Probability & Statistics can improve results.
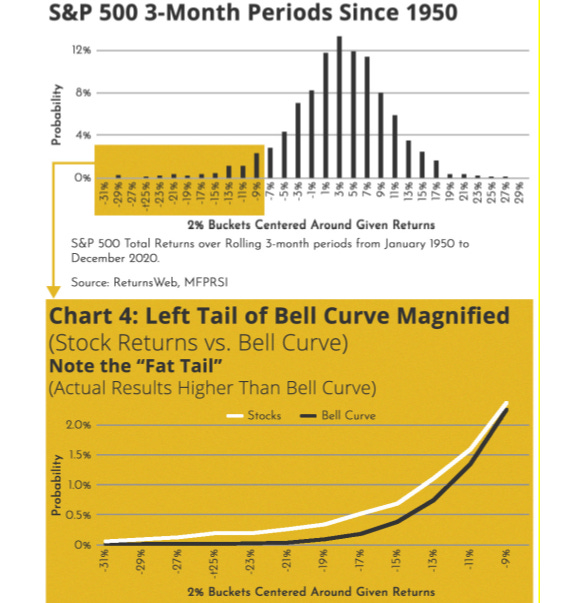
Many occurrences in nature, science, and business can be described by the bell curve or standard normal distribution. The chart below (from one of my papers) shows quarterly stock market returns graphed — and how the graph looks like a bell curve. However, upon closer inspection, you can see that things are not quite what they seem.
The edge of the curve is wider, or fatter, than the bell curve. That is, investment returns actually exhibit more occurrences at the tails than the bell curve would predict. The bottom (colored) portion of the chart zooms in on the tail of stock market graph. This behavior is referred to as fat-tails and reflects the fact that we get larger moves to the downside (crashes) - and upside - than expected by statistical models.
Certain markets, such as currencies and fixed income, exhibit even fatter tails and is the basis for certain quantitative investment approaches such as liquid absolute return and other related quant models.
Sports Analysis
Analysts study data and develop models to gain excess returns in the financial markets. These methods can also be used in sports analysis.
Friends and family may know that I have a database of sporting events and use this when thinking about sports. In several NFL pools this season, I placed well, winning some pools and placing in the top 0.02% in a large nationwide (international?) pool of almost 100,000 entrants. Quantitative analysis won’t always work - but it can help improve results and repeatability.
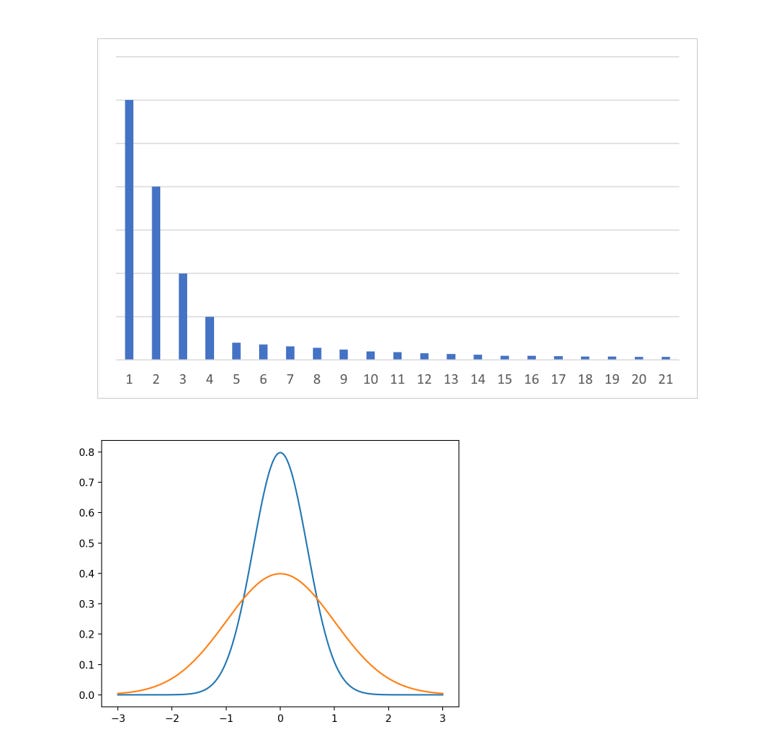
In addition to models that generate a measurable edge, game theory and contrarian approaches can add value. One of the large pools had material payoffs to the top 20 or 25 players. Entering the final week of the NFL regular season (when the pool would end), I was hovering in about 4th to 11th place — with an expectation of about 7th place. The chart below shows the asymmetric payoff in the pool.
In addition, by this point in the season, we knew how the other top competitors would make their selections for Week 18. Being almost indifferent between 7th place and 12th — but wanting to climb in the standings, we went for a contrarian approach — still using certain edges, but trying to go counter to what other top players were expected to do.
In effect, I went for a wider distribution of results — willing to sacrifice some downside (but smaller loss) — in an attempt to gain on the much higher payoff on the left side of the curve.
At the moment when New England had first & 10 at the Buffalo 13 with 6:14 left in the game, I was projected to be in first place. Alas, the Patriots didn’t convert, and I finished in 4th place. Still, a nice gain in the standings.
Quant Facts
Our readers will also know that we apply quant facts to championship factors related to sports psychology. That is our “Who Will Win the Big Game” series of articles. After the results of the 2022-23 College Football Championship, our quant fact predictions now stand at 66-38, or 63.5%. This represents over ten years of published predictions, regularly picking underdogs. Thank you for reading!
Other Articles
2022-23 College Football Championship
Investments: 2022 Recap and 2023 Outlook
Who Will Win the 2022 World Series?
Carlton Chin, a graduate of MIT, is an investment officer and portfolio strategist. When not studying alternative investments, downside risk, and portfolio construction, he enjoys applying numbers and probability to sports analytics. He has worked with various sports organizations, including the Sacramento Kings — and has been quoted by the New York Times, the Wall Street Journal, and ESPN.


