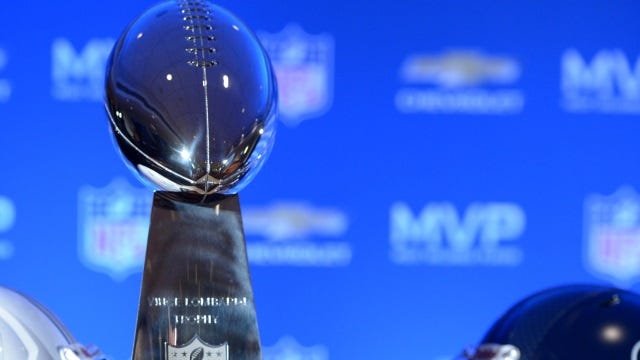
Who Will Win the Big Game? 2024 Super Bowl
Quant Facts predict the winner of this year's game between the SF 49ers and KC Chiefs
Based on research with a sports psychologist friend, Dr. Jay Granat, years ago, we developed a model that was published in the Wall Street Journal (Past Super Bowls Could Point to Winner, Wall Street Journal, January 2010). These factors attempt to quantify sports psychology factors such as confidence, minimizing errors, consistency, and coachable hard work.
Key factors:
Consistency: Based on San Francisco’s entire body of work (or their entire season), SF is more impressive than the Kansas City Chiefs. On the other hand, KC has been more impressive during the latter part of the season. Still, this factor goes to SF.
Big Game Experience: With KC getting to the Super Bowl in 3 of the last 4 years, and winning last year, KC has the important big game experience edge.
Defense: This is very close, but certain analytics favor KC. Note the high percentage of drives KC’s defense forced a punt (Table below).
Minimizing Errors: SF scored close to 500 points during the regular season (vs. 371 for KC), while throwing just 12 INTs (vs. 17 for KC). Edge: SF.
Each factors is related to winning the Super Bowl at about 65%. Overall, the sports psychology factors lean towards San Francisco.
Monte Carlo Simulation Applied to Football
In previous years, we developed a model for the Super Bowl. Here, we apply the model to this year’s Super Bowl teams: the San Francisco 49ers, and the Kansas City Chiefs.
The average team in the NFL scores a touchdown (or TD) about 21% of the time, and scores a field goal (or FG) about 14% of the time. The chart below shows the results of drives for the average NFL team, as well as the results for this year’s Super Bowl teams. We also show the results for each team’s defense.
Table 1: NFL Drive Probabilities
Once we have the probabilities, we can use a random number generator to play out games. More specifically, we compute the expected results for each drive based on each team’s offense against the opponent’s defense. We can do this 11 times (models can also vary the 11-drive number) to generate game results – and then generate thousands of games.
Poll: Who do you think will win?
Super Bowl Prediction
This year’s Super Bowl will be a study of additional storylines such as:
SF’s entire season vs. KC’s stronger recent performance.
SF’s offensive machine vs. KC’s drive-stopping defense.
KC’s red zone efficiency in 2023 vs. recent history. This year, KC scored TDs on just 23% of its drives, compared to 35% last year.
The quant models favor the San Francisco 49ers to beat the Kansas City Chiefs, by an average score of 26-21. However, the most common score, based on key numbers (such as the 7 for touchdowns and 3 for field goals) is 27-21 for San Francisco.
Another useful output of Monte Carlo simulations is that we can generate probabilities. For instance, based on the above results, you might expect a close game. However, the model shows there is a 53% chance the game will be decided by at least 10 points – either way.
Related Articles
Super Bowl Square Pools By Quarter (2024 Update)
Do you have your Super Bowl Square Pool box yet? The Super Bowl kicks off soon — and many people are getting in on the popular 10x10 Square Pool. The great thing about these pools is that it is totally random, so if you are watching the game, you have a “fair” rooting interest.
Michigan vs. Washington: Who Will Win College Football's Big Game on 1/8/24?
College football’s championship game features the Michigan Wolverines against the Washington Huskies. What do our quant facts say about this year’s title game? Our championship factors are based on decades’ worth of championship results across the major sports, including the
2023 Super Bowl: Who Will Win the Big Game?
The Kansas City Chiefs and Philadelphia Eagles kick-off the 2023 Super Bowl in about one week. About a decade ago, a colleague and I performed research on decades’ worth of championship results across the major sports, including the NFL, NBA, MLB, and
Carlton Chin, a graduate of MIT, is an investment officer and portfolio strategist. When not studying alternative investments, downside risk, and portfolio construction, he enjoys applying numbers and probability to sports analytics. He has worked with various sports organizations, including the Sacramento Kings — and has been quoted by the New York Times, the Wall Street Journal, and ESPN.
Dr. Jay Granat, psychotherapist, named one of America’s Top 10 Mental Gurus by Golf Digest, has worked with Olympic athletes & sports organizations. He is the owner of StayInTheZone.com and has authored several books on sport psychology — appearing on ESPN, CBS & Good Morning America.


Nice work Carlton! Always enjoy your fact-based perspective; we need more of this in the world! Great job predicting the Michigan win! Hope all is well,
Brad Klinck